There are those annual routine processes businesses go through – financial planning, strategic alignment, reporting, employee satisfaction surveys and many more in order to keep moving forward. However, in our experience, the one that tends to get overlooked yet is among the most important is succession planning. Taking the initiative to track succession planning metrics will help you understand how you’re really doing and what you need to do better.
The ability of a business to execute its strategy and be successful depends largely on having the right leaders and talent in place – at the right time, in the right role. Often this isn’t the case and the consequences are now being felt with the ‘Great Resignation’.
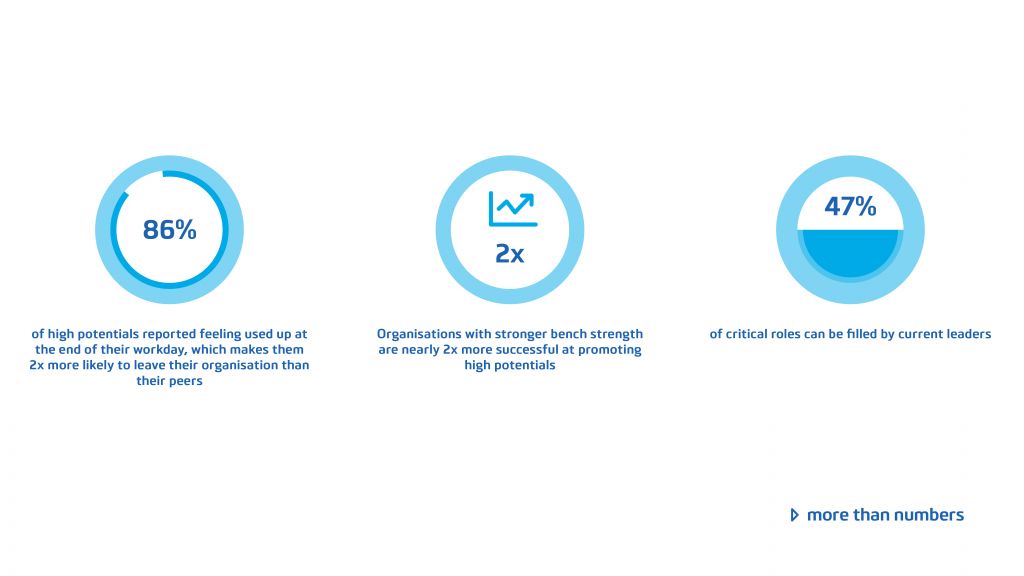
In fact, according to Deloitte, while 86% of leaders believe succession planning is important or even an urgent priority, only 14% believe they are doing it well. Add in the challenges of flexible work arrangements in the post-Covid world, the unpredictability of work and economic concerns, preparing for multiple futures is critical with succession planning becoming an urgent need.

Types of succession planning metrics
There are two types of succession planning metrics, quantitative & qualitative, with both playing an important role in presenting an accurate picture of the state of succession planning in your business.
- Quantitative metrics – Numbers are the kind of metrics the board wants to hear including numerical data, stats, charts, graphs.
- Qualitative metrics – These metrics are more subjective but still provide valuable information and include various types of feedback, analysis of open-ended comments, sentiment analysis.
What metrics can help with succession planning?
There are 10 key metrics that can assist your business with succession planning.
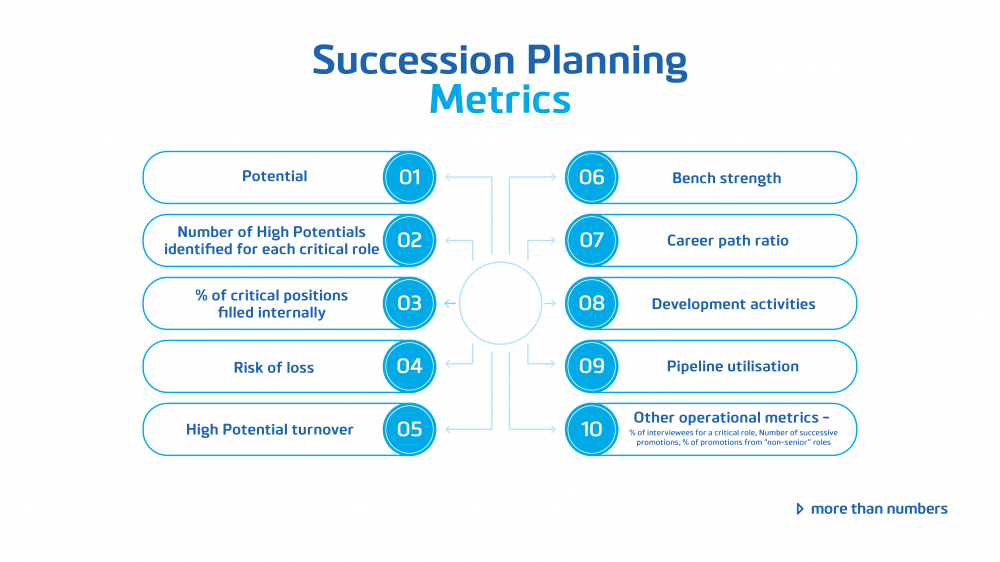
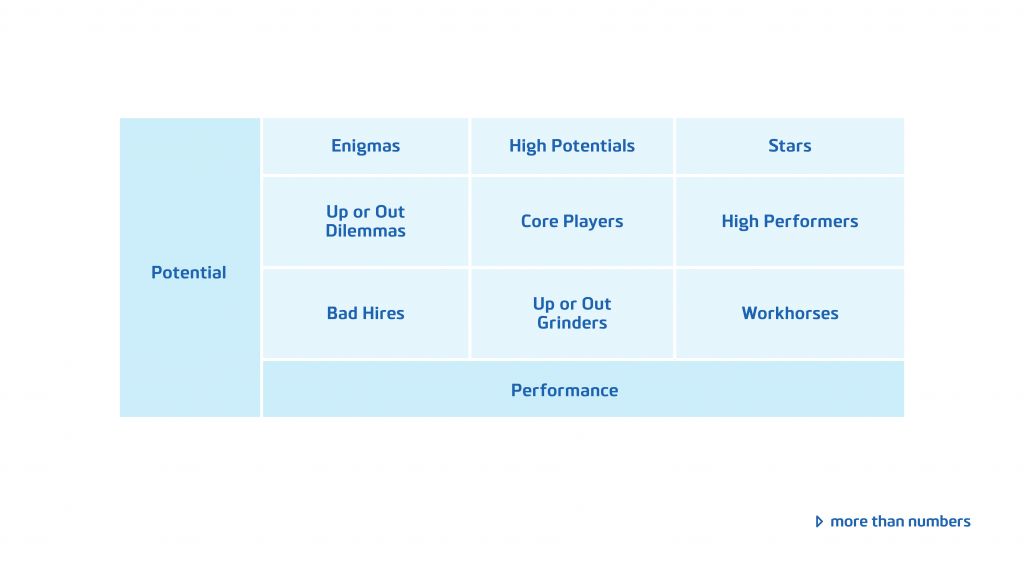
1. Potential – employees with high potential have that combination of motivation and ability to succeed in senior positions. It’s crucial your business retain, nurture and develop these employees and make a place for them in your succession plan. The 9-box Grid (below) helps measure potential. Succession planning focuses on the ‘Stars’ and ‘High Performers’ since these are the employees who will build the future of your business. Plot your employees on the grid by:
- Assessing performance – use annual performance reviews, 360-degree feedback and quantitative data such as sales and net promoter scores to determine if performance is low, moderate or high.
- Assessing potential – use data from peers, managers, direct and indirect reports and the leadership team to determine how well an employee is likely to perform in the future – their growth potential. There is no mathematical formula to calculate talent which is why qualitative feedback from clients/customers and the team are essential.
2. Number of High Potentials (HiPos) identified for each critical role – A critical role is one of high importance to business operations or has a unique skill set of knowledge base and will impact the business over the next 5-10 years. A HiPo has that combination of aspiration, engagement and ability:
- Aspiration – the willingness and drive to move to more senior roles and leadership positions, measurable through personality profiles and speaking to employees about their aspirations.
- Ability – the capability to be effective in more senior roles, measurable through performance and various projects/assignments.
- Engagement – the willingness to remain engaged and committed with the business, measurable through various surveys and qualitative data from discussions between employee and manager.
When those HiPos have been identified you will want to match them to critical roles. At least two successors for each critical role, who are ideally HiPos, is best practice.
3. Percent (%) of critical positions filled internally – this will measure your ability to develop internal talent and whether or not your succession plan is actually working. Compare this % to the % of critical roles filled with external candidates. This metric can also be used for management positions. This data can be extracted from your recruitment stats – where did those holding critical roles come from?
4. Risk of loss – Also known as ‘flight-risk’ this measures how likely it is that a high potential employee will leave in the next X months. This metric is unable to be predicted precisely (no one can see the future) however there are measures that can provide indicators of when a high potential employee might leave.
- HiPs are paid below the market – you can conduct a compensation analysis, compare the results internally and use external benchmarks to determine.
- Change of role – if a HiPo recently moved into a role that does not align with their aspirations and goals they are more likely to leave. The level of satisfaction can be determined during 1:1 conversations with managers and via annual employee satisfaction surveys.
- Big life change – If there has been a sudden loss of a significant person, or they are forced to relocate to another state or country, there is a high chance they might leave. A proactive business looks at what can be done in these moments to offset resignation and be as accommodating as possible.
5. High Potential turnover – To calculate high potential turnover, divide the number of HiPos who left by the number of HiPos in the business. The turnover rates will quantitatively indicate if it is of concern or not. You can measure if it is above average compared to the rest of the workforce in the business. Exit interviews of HiPos are also an effective way to understand why they left and what your business could have done better to keep them.
6. Bench strength – Bench strength refers to a business’ ability to fill critical positions internally and can commonly be evaluated by looking at the percentage of HiPo employees or managers that you’ve identified as ready for promotion. Divide the number ready for promotion by total HiPo/management number to get the result.
How do you know when an employee is ready for promotion? Here are a few things to consider:
- Capacity – Always asking for more work
- Complexity – Already doing parts of a job of a higher role
- Performance – Results are consistent and of a high level
- Resourcefulness – They are already seen as a source of knowledge and a reference point
7. Career path ratio – This measures the employee growth rate through the number of promotions – lateral and vertical. Divide the total number of promotions (upward) in the business by all role changes (both lateral and upwards) in order to calculate the career path ratio. Here is how to interpret the results
- 0.7 – signals frequent promotions
- 0.2 – there might be an issue with the promotion process and little movement within the business
A succession plan is not only about promoting the top HiPos but everyone along the way. Good movement, both lateral and upwards, is crucial.
8. Development activities – Another set of metrics to track is the tools and development activities that support effective succession planning, including:
- Learning and development activity – Understand how much learning activity has taken place with your HiPos and potential successors.
- Development plan – Understand if every person marked as a successor has a (leadership) development plan that helps them develop the competencies and expertise they need to transition to a more senior role.
- Management support of talent development – Understand that as part of every manager’s goals, developing key talent and successors should be a core objective.
- Quality of information – Understand the effectiveness of information capture, both in performance feedback systems and through annual talent development conversations.
9. Pipeline utilisation – The percentage of time an employee from a succession plan is used to fill a vacant role, either a critical role or a management position. This is the measure of whether succession planning is just done as a ‘tick-a-box’ or if it is actually being used to make decisions.
Divide the number of employees from the succession plan promoted / number of employees promoted to a vacant role to calculate.
10. Other operational metrics – There are other clear indicators of whether or not a succession plan is in effective operation in a business:
- % of interviewees for a critical role – In an ideal world 100% of candidates interviewing for a critical role should be part of the succession plan. These are employees who should have had opportunities to develop themselves before interviewing for the position.
- The number of successive promotions – The % of employees that are marked as key/critical and how many times they have been promoted within a three-year period.
- % of promotions from ‘non-senior’ roles – That your succession plan considers not only employees in management positions but also junior positions or those without long tenure. This means that the business is keeping an eye on star talent at any given stage of the employment cycle.
Beyond Advisors offers professional advice, including succession planning, for businesses of all shapes and sizes. For any help or assistance on the data you need for succession planning you can get in touch with our helpful team today.