In a follow up to our article on leadership by the numbers in extreme environments, we discuss the importance of having your business model documented in numbers. This will allow you to convert the data analytic work you have done into a financial framework that will tell you whether the decisions you are proposing will likely increase or diminish profit, cash and value.
The businesses we work with, that have had this type of modelling in place coming into this time of increased volatility and risk, have experienced substantially better outcomes than those who have not invested in this level of understanding of their businesses.
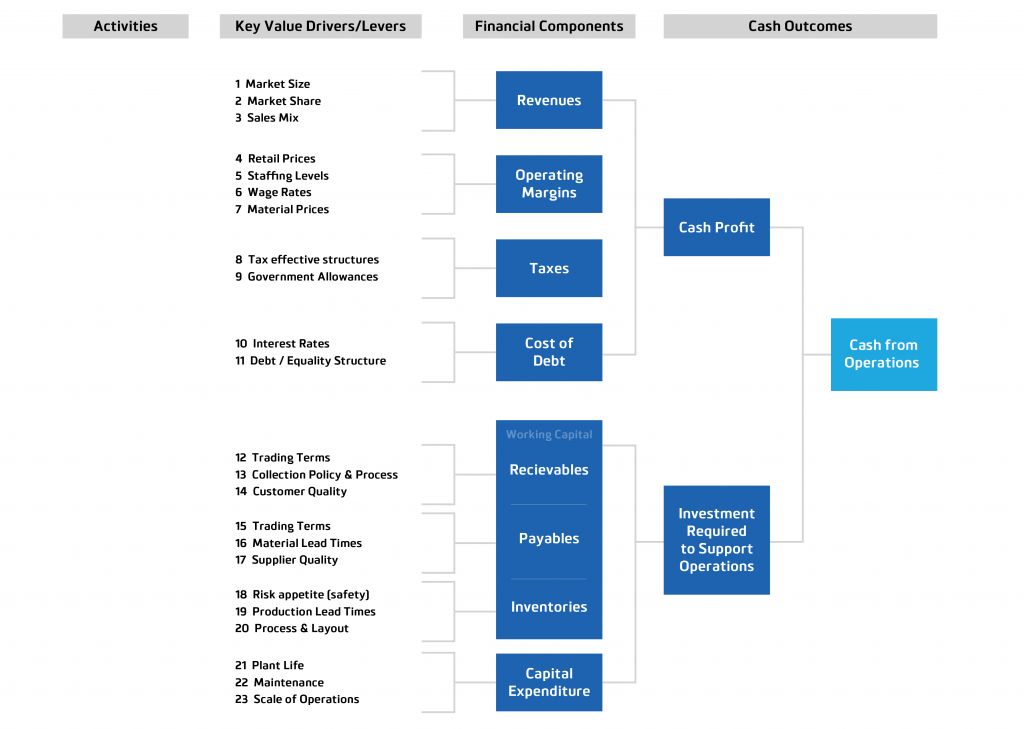
Critical activities that drive the business, need to be identified, measured and tracked. Ideally, we can establish a connection or relationship between the activity and the business results achieved. The following illustration shows an example worksheet to assist in identifying how your business creates value.
How do I start building a data driven business model?
Step 1 – Understanding what the key value drivers of the business are
What are the things we do that drive value? Value is measured by increasing cash from operations and/or the capital value of the business.
Step 2 – Define how these drivers work
Map it out in numbers. As an example, how does sales activity result in increased revenue? If our business relies on telephone sales to drive revenue then the map could include this:
- How many calls does one consultant make per day?
- How many consultants do we have?
- Who are they calling (segment the activity)?
- How many calls are answered?
- How many calls result in a sale? (conversion rate)
- What is the average value of the sales achieved?
Step 3 – Attach a cost to the driver activity
What is the labour cost per call, the telecoms cost, and the cost of any conversion activity to get to the point of recording a sale?

Step 4 – Design a data capture solution if one does not already exist
Step 5 – Track and measure the activity for an appropriate period of time
Step 6 – Analyse data and look for insights
What are the patterns in performance across segments, sales consultants, geography etc.?
Step 7 – What can we learn from the data?
Should we adjust the activity to optimise our results? With sufficient quality data, a mathematical optimisation model can be built to determine the approach that will achieve the best result.
Once this has been done for each key driver, the relationships between the drivers will be mapped into a financial model that can provide scenarios to support complex decision making that impacts multiple areas of the business to provide a result in terms of cash flow or business value.
This highly detailed approach to the modelling of an organisation allows business owners and managers to make decisions with more confidence that if they execute the plan they will get closer to the desired result. The model also makes it easier to explain why the plan has been missed and therefore makes corrective actions easier to identify.
Consistent and regular capture of data around these drivers is critical in the current environment. Some of these drivers will be on management’s radar on a weekly basis others may be reviewed less frequently.
Management and Boards need to be clear on how fast their environment is changing and how frequently these drivers need to be revisited. If we take our eye off the ball for too long we will see value destruction and increased risk. With consistent application of the process, management can be far more proactive in their decision making, seeing problems before they do too much damage.

What happens when we take our eyes off the numbers?
We worked with a client recently that came to us after being surprised by the loss of margins in one of the business units. That business had “always run at 30% gross margin, this makes no sense”. It happened very quickly and was picked up when the cash burn was too much to ignore. After working through the data analysis and constructing the business model, it became clear there was a disconnect between the sales team quoting, the business’ understanding of what was happening, and the cost profile of the jobs that the operations team were delivering. Once the problem was understood by all parties an approach to begin correction was able to be put in place.
With the volatility in the market continuing, and potentially worsening, keeping a close eye on the data is critical from an understanding and communication standpoint. And, it’s needed to facilitate better decision making across the organisation. The business will require continual tweaking to stay in front of the changes. Having the data in a financial model gives context to the decisions and also provides motivation to action.
Just as importantly as showing the impact of the actions we plan to take, it will also show the cost and impact of inaction, which could be catastrophic.
To discuss how key drivers can help your business please contact us at Beyond Advisors. We’re here to help build stronger business communities through better decision making.